How Facebook ad costs work: CPM, CPC and ROAS unpacked
Facebook has no fixed rate card. You pay an auction clearing price. In practice three numbers matter: CPM (cost per thousand impressions), CTR (click-through rate) and conversion rate. Multiplied together they set your cost per result, while ROAS (revenue divided by ad spend) decides whether the business works at all.
Ad cost is not one number. It is a chain of ratios multiplied together. Understand how they multiply and you know which one to move when cost goes up.
Facebook has no fixed rate card. You pay an auction clearing price, competing for the same person against every other advertiser who also wants to reach them. So "what does a click cost" has no standard answer.
The useful question is: which factors multiply to set my cost, and which one is easiest to move.
1. The cost formula
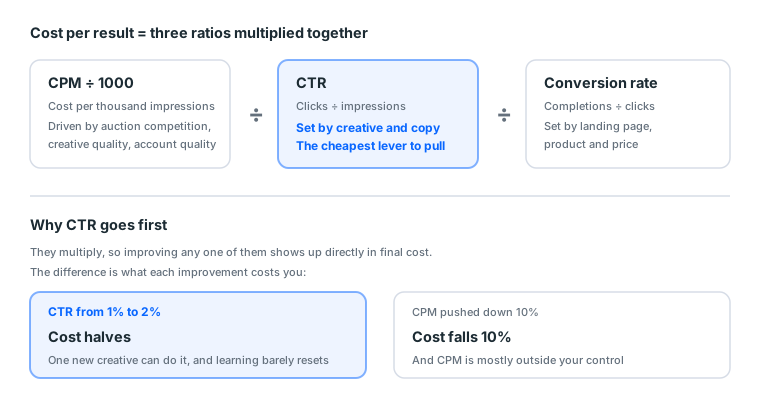
Cost per result =  CPM ÷ 1000
                 ÷ CTR
                 ÷ conversion rate
Which is to say:
| Metric | Meaning | Mainly driven by |
|---|---|---|
| CPM | Cost per thousand impressions | Audience competition, creative quality, account quality |
| CTR | Clicks ÷ impressions | Creative and copy (the biggest factor) |
| Conversion rate | Completions ÷ clicks | Landing page, product, price |
They multiply. Taking CTR from 1% to 2% halves cost outright, which is usually far more effective than pushing CPM down 10%, and considerably easier to achieve.
Run the numbers once
Say your data looks like this:
| Case A | Case B (creative changed only) | |
|---|---|---|
| CPM | $30 | $30 |
| CTR | 1.0% | 2.0% |
| Cost per click | $3.00 | $1.50 |
| Conversion rate | 3% | 3% |
| Cost per conversion | $100 | $50 |
The only difference between the columns is creative, and cost differs by half. That is why "change the creative first" is not casual advice.
Now compare pushing CPM instead:
| Case A | Case C (CPM down 10%) | |
|---|---|---|
| CPM | $30 | $27 |
| CTR | 1.0% | 1.0% |
| Cost per conversion | $100 | $90 |
A 10% improvement, and CPM is mostly not yours to control. It is set by the auction environment, and the part you can influence (creative quality, account quality) improves via creative anyway.
2. The four numbers to watch in practice
In the Ads Manager table, four columns earn their place:
- Cost per result: the single most important number
- CPM: whether the auction environment moved
- CTR (link click-through rate): whether the creative lands
- Amount spent: whether it is pacing to budget
Everything else can wait a month.
How to read each one
| Number | How to read it | What wrong looks like |
|---|---|---|
| Cost per result | Against your break-even | Three consecutive days well above break-even |
| CPM | Against your own last week | Doubling in a day |
| CTR | The absolute value is informative | Below 0.3% usually means the creative missed |
| Amount spent | Against budget | Only 20% of budget spent |
Only CTR has a broadly applicable absolute benchmark. The other three are comparisons against yourself. This trips a lot of people up: they compare somebody else's CPM against theirs and draw the wrong conclusion.
How many days before you can judge
| What you want to judge | Minimum days |
|---|---|
| Whether money goes out | 1 |
| Whether the creative lands | 3 |
| Whether cost is acceptable | 3–5 |
| Whether to raise budget | 5–7 |
| Whether creative has fatigued | 7–14 |
One day of data settles nothing, least of all during learning. The classic beginner error is seeing high cost on day one and changing something, which restarts learning, which raises cost, which prompts another change. The loop never exits.
3. ROAS: whether this business works
ROAS = revenue from ads ÷ ad spend
ROAS 3 means every dollar spent returned three in revenue. That is not the same as profit. Margin decides.
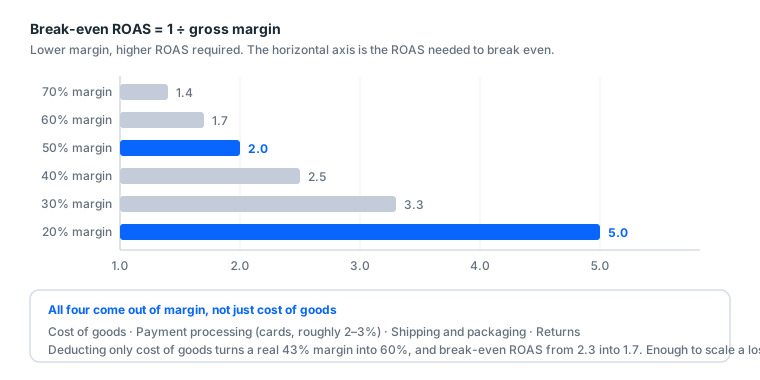
| Your gross margin | Break-even ROAS |
|---|---|
| 20% | 5.0 |
| 30% | 3.3 |
| 40% | 2.5 |
| 50% | 2.0 |
| 60% | 1.7 |
| 70% | 1.4 |
Work out your own break-even ROAS before reading any ad data. Adjusting ads without that number means not knowing where the target is.
Calculating your break-even ROAS
Break-even ROAS = 1 ÷ gross margin
Gross margin is what proportion remains after direct costs come out of the sale price. Direct costs include:
- Cost of goods or materials
- Payment processing (cards are typically 2% to 3%)
- Shipping and packaging
- Returns
A lot of people deduct only cost of goods and forget payment and shipping. Take a $30 product with $15 of goods cost. That looks like 50% margin. Add 3% payment processing, $2.40 shipping and 5% returns, and the real margin is about 37%, which moves break-even ROAS from 2.0 to 2.7.
That gap is enough to make you scale a campaign that is actually losing money.
One more number beyond ROAS
Lifetime value. If your product gets repurchased, the first transaction's ROAS can sit below break-even, because what you bought was a repeat customer.
The test: work out how many times an average customer buys. If it averages 2.5, you can accept about 40% of break-even ROAS on the first transaction and recover the rest through repeats.
Products without repeats cannot use this. A one-off purchase must break even the first time, or scale simply multiplies the loss.
3b. The auction: who your money is actually competing with
Once this section clicks, every "why" above becomes intuitive.
Advertising is a real-time auction
Every time somebody opens their feed, the system runs an auction to decide whose ad they see. Everyone who put that person in their audience is entered.
But the highest bid does not win. Meta uses a combined score:
Total value ≈ your bid × estimated action rate × ad quality
Three factors:
| Factor | Meaning | Can you control it |
|---|---|---|
| Bid | What you will pay for this result | ✅ Directly |
| Estimated action rate | The system's odds this person completes your action | 🟡 Indirectly, via accumulated signal |
| Ad quality | User feedback, hide rate, report rate | ✅ Through creative |
This explains three things
One: why good creative is cheaper. Good creative gives good user feedback and a low hide rate, which raises the ad quality score, which lets the same bid beat a higher one. You are not winning by spending more. You are winning because the system considers your ad worth showing.
Two: why new accounts cost more. A new account has no conversion signal, so the system cannot estimate action rate accurately and defaults to conservative. A conservative estimate means you must bid higher to win, so cost is high. Once signal accumulates the estimate sharpens and the same money buys more.
Three: why a narrow audience is more expensive. Small audience, fewer auctions entered per day, slower sample accumulation, so the system never finds a pattern, so estimated action rate stays inaccurate, so cost never falls. And if other advertisers are chasing that same narrow slice, competition is more concentrated.
Bid strategy: which one for a first run
| Strategy | Meaning | Beginner |
|---|---|---|
| Highest volume | Spend the budget, get as many results as possible | ✅ Use this first |
| Cost cap | Keep average cost under a value | 🟡 You need a baseline first |
| Bid cap | Never bid above a value | ❌ Easy to win nothing at all |
| Highest value | Maximise total value | ❌ Needs value signal |
Use highest volume for the first run, because you do not yet know your baseline. Set a cost cap below the going market rate and the ad simply will not deliver, and you will think something else is broken.
Once you have run two full weeks and know roughly where your cost per result sits, consider a cap.
4. When cost rises, which lever to pull
Ranked by effect over cost:
| Order | What to change | Why |
|---|---|---|
| 1 | Change the creative | Biggest effect on CTR and CPM, smallest cost |
| 2 | Rewrite the first two lines of copy | Phones truncate; those two lines decide whether they read on |
| 3 | Check the landing page | Conversion rate is a multiplier; a slow or awkward page destroys everything |
| 4 | Adjust the audience | Real effect, but resets learning |
| 5 | Adjust budget | Only affects volume, not efficiency directly |
Do not change five things at once. You will not know which one worked.
Diagnose the layer before touching anything
Three steps that eliminate most blind fiddling:
- Did CPM move? Yes → auction environment or account quality, not your creative. Observe three days.
- CPM flat but CTR dropped? → Creative fatigue. Change creative.
- CPM flat, CTR flat, but cost per result high? → The problem is the landing page or the product, not the ad.
The most common error is swapping creative when CPM went up. It achieves nothing, because the problem was never there.
What to do in each of the three cases
Case one: CPM up, CTR unchanged. The auction environment changed (a seasonal peak, competitors entering) or account quality declined. Observe for three days while checking Account Quality for violation records. Seasonal means ride it out; an account quality problem means the account is what needs handling, not the ad.
Case two: CPM unchanged, CTR falling. Creative fatigue. The same people seeing the same thing repeatedly respond less. Check frequency (impressions ÷ reach). Frequency clearly rising while CTR falls confirms it. Change the creative, or change the audience.
Case three: CPM and CTR both normal, but conversion cost high. The problem is not the ad. People arrived and did not complete the action. Go look at landing page data: bounce rate, time on page, add-to-cart rate. The ad already did its job.
5. The costs that are not ad spend
Counting only ad spend understates the real number. There is also:
| Item | Detail |
|---|---|
| Asset cost | Pages, BMs, ad accounts. Considerable if your account mortality is high |
| Downtime | Revenue is zero while an account is disabled. This is the real reason experienced buyers pay more for accounts |
| Your time | Two hours on an account that was never coming back costs more than the account |
| Management fees | If outsourced, usually a percentage of spend or a retainer |
Run the asset cost with our real prices
Our catalogue has 145 display groups. The price distribution:
| Price (USDT) | |
|---|---|
| Minimum | 2 |
| 25th percentile | 8 |
| Median | 10 |
| 75th percentile | 26 |
| Maximum | 200 |
Mean price is 23.9 USDT.
Say your daily budget is 30 USDT and you replace two accounts a month at the median price:
Monthly ad spend  = 30 × 30 = 900 USDT
Monthly asset cost = 10 × 2  =  20 USDT
Asset cost share   = 2.2%
Only 2.2%, which looks unimportant. But at two accounts a week:
Monthly asset cost = 10 × 8 = 80 USDT
Asset cost share   = 8.9%
And with downtime, the real impact is well beyond 8.9%. Every replacement means warming up again and running the learning phase again, and that stretch is your least efficient spend.
Downtime is the real number
| Daily budget | Revenue lost per day down (at ROAS 2) | Price gap to a better account |
|---|---|---|
| $10 | $20 | $3–10 |
| $30 | $60 | $3–10 |
| $100 | $200 | $3–10 |
| $300 | $600 | $3–10 |
The upgrade test is simple: when a day of downtime costs more than the price gap to a better account, upgrade.
Somebody spending $10 a day buying the most expensive account is wasting money; somebody spending $200 a day saving 10 USDT has their priorities inverted. Differences between tiers are in account types and when to use them.
Bundles versus buying separately
Ignore "save 30%" claims. Compare parts total against bundle price:
| Bundle | Bundle price | Parts total | Saved | Discount |
|---|---|---|---|---|
| First run | 39 USDT | 48 USDT | 9 USDT | 18.8% |
| Account died again | 49 USDT | 62 USDT | 13 USDT | 21.0% |
| Local market | 89 USDT | 108 USDT | 19 USDT | 17.6% |
| Steady running | 129 USDT | 143 USDT | 14 USDT | 9.8% |
The steady-running bundle has the smallest discount (9.8%) but contains the most expensive items. A low discount percentage does not mean poor value. What matters is which pieces you were going to buy anyway. If you only need two of them, separate is cheaper.
6. Why new accounts start expensive
Three factors compound:
- Low spending limit: you cannot get volume, so no scale efficiency
- No conversion signal: the system does not know who to show it to, so it guesses
- The learning phase: every significant change restarts it
So the right move on a new account is not spending hard until it gets cheap. It is producing a record first: small budget, few changes, letting signal accumulate. Full rhythm in the gradual scaling curve.
What the first four weeks look like
| Period | Relative cost | What you do |
|---|---|---|
| Days 1–3 | Highest | Change nothing, just confirm money goes out |
| Days 4–7 | Starting to fall | First judgement; decide about creative |
| Days 8–14 | Clearly improving | Start raising budget along the curve |
| Days 15–28 | Settling | Now the numbers are your baseline |
Do not treat week one's cost as a verdict on the product. That number is necessarily ugly, because the system is spending money to buy information.
6b. Following along: the full arithmetic on a $30 product
Formulas above, a worked example here. This is the fastest way to see where money leaks.
Step 1: work out the real margin
Say you sell a $30 product:
| Item | Amount | Note |
|---|---|---|
| Price | 30.00 | |
| Cost of goods | −12.00 | Purchase or production |
| Payment processing | −0.90 | About 3% |
| Shipping and packaging | −2.40 | |
| Returns | −1.50 | About 5% |
| Gross profit | 13.20 | |
| Margin | 44.0% |
Deduct only cost of goods and you would calculate 60% margin. That gap magnifies in the next step.
Step 2: break-even ROAS
Break-even ROAS = 1 ÷ 0.44 = 2.27
Using the wrong 60% figure gives 1.67. You would scale a campaign at ROAS 2.0 believing it profitable, while every order loses money.
Step 3: convert to a cost ceiling per conversion
Max ad cost per conversion = 30.00 ÷ 2.27 = $13.20
So as long as acquiring one order costs less than $13.20 in ads, you are ahead.
Step 4: work back to a cost ceiling per click
Say your landing page converts at 3%:
Max cost per click = 13.20 × 3% = $0.40
That is the number to watch daily. It is far more concrete than "what ROAS do I need", because Ads Manager has that column already.
Step 5: check feasibility
Now look at your actual data:
| Your actual CPC | Verdict | What to do |
|---|---|---|
| Below $0.40 | Profitable | Raise budget along the curve |
| $0.40 to $0.60 | Near break-even | Improve CTR or the landing page first |
| Above $0.60 | Losing money | Stop and rethink; do not raise budget |
Step 6: find the most effective improvement
Same target (cost per conversion from $18 down to $13.20), three routes:
| Improve which | By how much | Difficulty |
|---|---|---|
| CTR from 1% to 1.4% | +40% | Moderate; a new creative can do it |
| Conversion rate from 3% to 4.2% | +40% | High; means changing the landing page and product |
| CPM from $30 to $21.50 | −28% | Very high; mostly outside your control |
The three routes have identical effect and wildly different costs. That is the mathematical basis for "change creative first", not a rule of thumb.
Three common errors in this calculation
One: deducting only cost of goods. Payment, shipping and returns all come out. The gap was shown above.
Two: using average order value instead of this product's price. With several products, calculate separately, because margins differ.
Three: forgetting repeats. If customers average 2.5 purchases, the first transaction can carry a higher acquisition cost. But this needs real data, not a hoped-for number.
7. How to read ad management fees
If you are considering outsourcing, this section is for you.
The three common fee structures
| Structure | How it works | Favours you when |
|---|---|---|
| Percentage of ad spend | A fixed percentage of what you spend | Spend is small |
| Fixed retainer | A set amount monthly | Spend is large |
| Retainer plus performance | A base plus a results bonus | Both sides want to tie it to outcomes |
The thing to watch with percentages: the fee grows proportionally as your spend grows, while the workload does not necessarily grow with it. Running $3,000 a month and $30,000 a month are not ten times apart in operational complexity.
Three things to know yourself before outsourcing
- Your break-even ROAS. Without it, you cannot judge whether they are doing well
- Your current baseline. Without a baseline, any number can be described as "already good"
- Who owns the account. The most important one, expanded below
Which permission to grant
Advertiser, not Admin.
Admins can remove other admins, including you. It has happened that an engagement ended and the other party never removed themselves, or removed the original owner.
Advertiser permission covers the full job but cannot move your assets. See the permissions section in what is an ad account.
One more thing: the assets should sit under your BM, not the agency's. When the engagement ends, you want to remove a person and keep running, not negotiate to get your assets back.
7b. Building your own baseline
The piece repeatedly says "compare against yourself". This is how you build that self.
Why a baseline is mandatory
Without one you judge by somebody else's numbers or by feel, and both mislead:
- Their CPM reflects their vertical, region and season, not yours
- Feel makes you overreact to normal variance and underreact when something is genuinely wrong
With a baseline, "is this number normal" becomes a lookup rather than a judgement call.
How to build it
Run four full weeks, recording three numbers a day. At the end you have:
| Metric | What you record | Used for |
|---|---|---|
| CPM | Average and range | Judging whether the auction environment moved |
| CTR | Average | Judging creative |
| Cost per result | Average, and your best three days | Judging whether to raise budget |
| Frequency | Which day it starts clearly rising | Judging how fast the audience wears out |
One spreadsheet is enough. The columns are date, spend, impressions, clicks and results; everything else is a formula.
What the sheet looks like
| Date | Spend | Impr. | Clicks | Results | CPM | CTR | Cost/result |
|---|---|---|---|---|---|---|---|
| 08-01 | 5.00 | 5,000 | 55 | 2 | 1.00 | 1.1% | 2.50 |
| 08-02 | 5.00 | 4,800 | 60 | 3 | 1.04 | 1.25% | 1.67 |
| 08-03 | 5.00 | 5,200 | 48 | 2 | 0.96 | 0.92% | 2.50 |
Record the first five columns; the last three are formulas. This sheet's value in three months is far above the ten minutes it costs now.
How often to refresh the baseline
Quarterly. The auction environment moves with the seasons, and judging November's data against March's baseline distorts things, especially around shopping peaks.
Three other events force a rebuild:
- The product or price point changed
- The main audience changed
- The account changed (a new account's cost curve differs from a mature one's)
7c. Four cost quirks outside the US market
Things English tutorials skip and non-US advertisers always hit.
① The hidden cost of currency
On a USD account your bank typically adds about 1.5% in foreign transaction fees. At $1,000 a month in spend, that is $180 a year.
It never appears in Ads Manager, only on your card statement, which is why most people never count it.
② Seasonal auction pressure
Retail calendars are highly concentrated in most markets. During the big shopping events, the same audience is chased by a lot of advertisers at once and CPM rises noticeably.
Two responses:
- Get budget and creative ready two weeks before the peak, rather than starting to test during it
- Rising cost during a peak is normal; do not judge it against your ordinary baseline and conclude the creative broke
③ The ceiling on a small-language audience
Smaller-language markets have a hard ceiling on reachable people. Two consequences:
- Audiences wear out fast, and frequency rises faster than in large markets
- "Just widen the audience" runs out of road quickly
So in a small market you change creative more often than you would in the US. The same people see you repeatedly, and fatigue arrives sooner.
④ Invoices and tax
Meta ad receipts download from the Billing page. Two things people always ask:
- The issuing entity is usually one of Meta's overseas entities, not a local company
- What downloads is a receipt, which is not the same as a locally compliant tax invoice in many jurisdictions
This runs into tax classification and accountants handle it differently. It is outside what we can advise on; ask yours.
8. A common misdiagnosis
"My CPM is higher than my competitors', so something is wrong with my account."
Usually not. CPM swings widely with region, vertical, season and that week's competition, so cross-account comparison is close to meaningless. The meaningful comparison is your own CPM last week.
If your own CPM doubles within a few days, that is worth investigating. Usually creative fatigue, an exhausted audience, or a shift in the overall auction environment such as a seasonal peak.
Why cross-account comparison fails
| Variable | Effect on CPM |
|---|---|
| Vertical | Large. Finance, insurance and retail are completely different auctions |
| Region | Large. The same product differs several-fold between countries |
| Season | Large. During shopping peaks everyone is chasing the same placements |
| Audience size | Medium. Very narrow audiences usually carry higher CPM |
| Creative quality | Medium. The system rewards better-performing creative with lower cost |
| Account quality | Medium. Accounts with violation records get marked up |
The first three you cannot control, and they matter most. So comparing CPM with somebody else compares your different verticals and timing, not who is better at this.
9. Five myths that cost money
"A higher budget makes the system try harder." Budget decides what you are willing to spend, not the system's effort. Too high a budget on a new account trips risk controls instead.
"Lower CPM is always better." Not necessarily. A very narrow audience sometimes has low CPM, and those people never buy. Watch cost per result, not one link in the chain.
"ROAS 3 means profit." Margin decides. At 20% margin, ROAS 3 loses money; break-even is 5.0.
"High cost means a bad account, so buy a pricier one." Nine times out of ten high cost comes from creative and the landing page, not the account. A more expensive account does not improve CTR.
"Running several ads at once finds the winner faster." Too many at once compete for the same audience, budget gets divided, and none of them finishes learning. One or two is enough for the first month.
9b. How the learning phase affects cost
The piece keeps mentioning learning. This section finishes the relationship.
Cost during learning is necessarily higher
The system starts out not knowing who inside your audience responds. It shows the ad to a small group, watches who clicks and who converts, and adjusts. That probing costs money, and that money lands in your cost.
So high cost during learning is not an anomaly. It is inevitable. The only question is whether learning ever ends.
What restarts it
| Action | Restarts learning | Cost impact |
|---|---|---|
| Large budget change (past 50%) | ✅ | High |
| Audience change | ✅ | High |
| Placement change | ✅ | High |
| Optimisation event change | ✅ | High |
| Pausing and resuming | ✅ | High |
| Creative swap | 🟡 Smaller effect | Medium |
| Copy edit | 🟡 Smaller effect | Medium |
| Renaming the ad | ❌ | None |
Pausing and resuming restarts learning, and almost nobody knows this. Plenty of people switch ads off at the weekend to save money, switch them back on Monday, then complain that cost went up. What they are doing is resetting the learning phase every weekend and paying the probing cost over and over.
The arithmetic: switching off two days a week means four learning restarts a month. If each restart raises cost by 30% for three days, that is 12 days a month at elevated cost, which is 40% of the time.
The budget saved by pausing at weekends is far below the cost of repeatedly restarting learning.
Three ways learning never finishes
- Audience too small: daily impressions are limited, so samples accumulate too slowly
- Budget too low: same mechanism
- Changing too often: every change restarts it, so it never completes
The third is the most common among beginners, and it is self-inflicted.
Which is why "change nothing for three days"
See high cost on day one, change something, learning restarts, cost rises, change again. You stay inside the learning phase permanently, paying the highest possible cost.
The right move: record for three days and touch nothing. After three days you have a curve, and a curve can be judged.
9c. Turning cost control into a weekly routine
Understanding the mechanism is not enough. You need a rhythm. Copy this one.
Daily (about 3 minutes)
- Set the date range to yesterday
- Record three numbers: spend, cost per result, CTR
- Check whether any ad flipped to rejected or error
What you do not do: change settings because one day's numbers looked bad.
Weekly (about 20 minutes)
- Set the date range to the last 7 days
- Add CPM and frequency, compared against last week
- Run the three-step diagnosis (CPM → CTR → landing page)
- Decide about raising budget (never above 50%, at least 48 hours apart)
- A sustained CTR decline means preparing the next creative set
Monthly (about 40 minutes)
- Reconcile: Ads Manager's monthly spend against the bill
- Recalculate your real margin, because costs move
- Update your break-even ROAS
- Check asset cost share (how many accounts you replaced this month)
Item 2 is the one people skip. Purchase costs, shipping and payment rates all move, and your break-even ROAS is built on margin. Margin changed and you did not recalculate means judging new data by an old standard.
The point of this table is restraint, not diligence
Beginners' problem is usually not looking too little. It is looking too often and wanting to act every time. Three minutes a day recording three numbers beats refreshing the report hourly, because the first accumulates a curve you can judge and the second only makes you decide inside noise.
9d. Three business types, three cost structures
"How do ad costs work" has a different answer depending on what you sell. These three are the most common.
E-commerce: watch ROAS
The result you want: orders.
The key number: break-even ROAS, calculated above.
What is distinctive: there is a specific revenue figure per order, so ROAS applies directly. The things to be careful about are calculating margin correctly and whether repeats exist.
Where it usually goes wrong: deducting only cost of goods, forgetting payment, shipping and returns. As shown, that gap is enough to make a losing campaign look profitable.
Lead generation (insurance, property, courses, B2B): watch cost per lead
The result you want: contact details.
The key number:
Acceptable cost per lead = average deal value × margin × lead close rate
Example: $1,000 average deal, 40% margin, 5% close rate:
1,000 × 40% × 5% = $20
So a lead costing under $20 in ads is profitable.
What is distinctive: ads only get you to "lead acquired". After that come follow-up, quoting and closing. So the close rate is your capability, not the ad's responsibility.
Where it usually goes wrong: using a hoped-for close rate rather than a measured one. Somebody doing this for the first time does not know their close rate, so they have to run a batch of leads to measure it. That batch is tuition.
App promotion: watch post-install behaviour
The result you want: installs, but what you actually care about is whether they use it and pay.
The key numbers: cost per install, plus retention and lifetime value.
What is distinctive: installs are cheap and churn fast. Watching only cost per install buys you a pile of people who installed and deleted.
Where it usually goes wrong: optimising for "install" instead of a key post-install action. The system is obedient. Ask for installs and it delivers installs, regardless of whether those people ever open the app again.
What the three share
| E-commerce | Lead gen | App | |
|---|---|---|---|
| Where the ad's job ends | The order | The lead | The install |
| Where your job starts | Landing page and product | Follow-up and closing | Retention and monetisation |
| Most common misjudgement | Margin calculated too high | Close rate is a hope | Only watching install cost |
The common thread: an ad's responsibility has a clear boundary, and problems beyond that boundary cannot be fixed by adjusting the ad. This is the root cause of people adjusting endlessly with nothing to show.
10. Quick glossary
| Term | In plain terms | Formula |
|---|---|---|
| CPM | Cost per thousand impressions | Spend ÷ impressions × 1000 |
| CPC | Cost per click | Spend ÷ clicks |
| CTR | Click-through rate | Clicks ÷ impressions |
| Conversion rate | Share of clickers who complete the goal | Conversions ÷ clicks |
| Cost per result | What one of your specified results costs | Spend ÷ results |
| ROAS | Return on ad spend | Revenue ÷ ad spend |
| Break-even ROAS | The ROAS needed to break even | 1 ÷ gross margin |
| Frequency | How many times one person saw it | Impressions ÷ reach |
| LTV | Lifetime value | Average transaction × average repeat count |
10b. When to stop
Possibly the most money-saving section here, because a beginner's most expensive loss is rarely getting it wrong. It is getting it wrong and continuing to raise budget.
Three signals to stop
One: five consecutive days with cost per result above 1.5× break-even.
Not three days, because three is still inside learning-phase variance. Five days consistently high is structural, not noise.
Once stopped, run the three-step diagnosis (CPM → CTR → landing page) and find the layer before touching anything.
Two: CTR under 0.3% after two creative sets with no improvement.
That usually means your message does not match your audience, and new creative will not save it. What needs rethinking is who you are talking to, not which image to use.
Three: conversion rate under 1% while the traffic itself is right.
People arrive, time on page is normal, and they do not buy. The problem is the product, the price or the page. Continuing to advertise just delivers more people to somewhere that cannot convert.
What to do after stopping
Do not switch it off and start over. Follow this order:
- Drop budget to minimum, do not stop entirely (stopping breaks your spend record and resets learning)
- Extract the data: best creative, best audience, best time of day
- Change one variable, usually creative
- Hold the low budget for three days and look for improvement
- Improvement means climbing back along the curve; no improvement means the next variable
The cost everyone forgets
Your own time.
Say your time is worth $15 an hour. An ad set that will not work, with an hour a day spent watching it, changing it and thinking about it, is $450 a month in time cost that appears on no report.
Set a time budget: "five more hours on this, and if it still will not run I change the subject." Writing your stop-loss as a number beats deciding by feel.
Stopping is not failure
An ad set that never worked tells you four things, provided you recorded them:
- This audience does not respond to this message
- Where this creative's CTR lands
- Roughly what your landing page converts at
- What range your actual CPM sits in
Those numbers are your baseline. The next campaign starts from data rather than guesswork, and that is what the money bought.
11. Three numbers to calculate before you start
- My gross margin (with payment, shipping and returns deducted, not just cost of goods)
- My break-even ROAS (1 ÷ margin)
- Whether my customers repeat, and how often (if so, the first transaction can carry a lower ROAS)
Until those three exist, reading an ad report is pointless, because you do not know what "good" means.
In one sentence: calculate break-even ROAS, watch cost per result, and change creative first when cost rises. Everything else is secondary.
Sources (all official pages, checked 2026-09-08). Prices, catalogue distributions and warranty ratios in this article are our own catalogue and ticket data, not taken from these pages:
- How much it costs to advertise on Meta — Meta Business Help Centre — facebook.com
- How the ad auction works — Meta Business Help Centre — facebook.com
- About the learning phase — Meta Business Help Centre — facebook.com
- Meta ads budget and pricing — Meta for Business — facebook.com
- Advertising Standards — Meta Transparency Center — transparency.meta.com
- Ad metric field definitions (Marketing API Insights) — Meta for Developers — developers.facebook.com
FAQ
What is the minimum I can spend on Facebook ads?
There is no official floor and daily budgets can be set very low. In practice start at about $5 a day for three days. The purpose is verifying the route works, not getting results.
What is a reasonable CPM?
There is no universal standard. It swings widely with region, vertical, season and competition. The only meaningful comparison is against your own CPM last week.
What ROAS do I need to make money?
It depends on your margin. At 50% margin you break even at ROAS 2. At 20% margin you need 5. Work out your break-even ROAS before reading any ad data.
What should I change first when cost rises?
Creative. Creative moves CPM and CTR far more than small audience adjustments, and changing it disturbs the learning phase less.
What is the difference between CPC and cost per result?
CPC is the cost of one click. Cost per result is the cost of whatever result you specified at campaign level. On a traffic objective they are close; on a conversion objective it is the cost per conversion.
What costs exist beyond ad spend?
Ad assets (accounts, Pages, BMs), revenue lost while an account is down, your own time, and management fees if you outsource. Counting only ad spend badly understates the total.
Why are new accounts more expensive?
Low spending limits mean no scale efficiency, no conversion signal means the system guesses, and the learning phase adds to both. Three factors compounding.
What frequency is too high?
There is no absolute number, but frequency rising clearly while CTR falls usually means the audience is wearing out, and you need new audience or new creative.
How are ad management fees usually charged?
Commonly a percentage of ad spend, or a monthly retainer. Watch that a percentage grows fast as your spend grows, while the workload does not necessarily grow with it.
Local currency or USD, which is better?
A USD account usually adds a bank foreign transaction fee of about 1.5%. A local currency account needs no conversion but denominates budget thresholds locally. Consistency across one business matters more than the choice.
What budget makes the system try harder?
Budget does not change how hard the system tries, only how much you are willing to spend. Too high a budget on a new account trips risk controls instead.
Why did my cost double in one day?
Check CPM first. If CPM moved, that is the auction environment or account quality, and you observe for three days. If CPM held and CTR fell, that is creative fatigue.
How many days of data before cost per result is meaningful?
At least three. Single-day data swings hard, especially during learning, and one day tells you nothing.
How often should I change creative?
Watch CTR. A sustained decline is the signal, not the calendar. Some creative fatigues in two weeks, some holds for a month.
Should I concentrate or spread my budget?
Concentrate, for the first month. Too many ads at once compete for the same audience, and a divided budget means no single one finishes learning.
Want the parts this article talks about?
Browse the full catalogueRead next
Running Facebook Ads: the complete path from nothing to your first live ad
The whole route on one page. From "where is Ads Manager" to "how do I
Facebook ad setup: from zero to your first live ad
Step by step, with a suggested value for every field. Follow it and yo
What is Ads Manager? Full interface tour and first-time setup
Ads Manager is Meta's console for building, running and monitoring ads
The gradual scaling curve from day eight
Budget is not whatever you feel like setting. Scale too fast and the s
Six things to know before buying a Facebook account
This market runs on serious information asymmetry. Here are the questi